Inference and Visualization Tutorial
Contents
Inference and Visualization Tutorial#
Welcome to the inference and visualization notebook! At this point, you should have a trained model and tiles to run inference. In this notebook we will run inference on a slide and visualize the results. Here are the steps we will review:
Run inference with a trained model.
Visualize the inference results
Run inference with a trained model#
Often tissue-based analysis on whole slide images benefit from annotations provided by expert pathologists. However, having pathologists annotate 1000s of slides is very time consuming and expensive. To overcome this bottleneck, it is common to have pathologist annotate a subset of the slides, and use that dataset to train a model. This model is then used to label the rest of the dataset.
In the model training notebook, we trained a ResNet-18 model on a subset of our slides with the annotated regions and labels. We will now use this trained model and the prepared tiles from the test slide to run the inference step.
[2]:
# TEMP
%env LUNA_HOME=/Users/rosed2/Documents/msk-mind/luna
%env PYTHONPATH=/Users/rosed2/Documents/msk-mind/luna/pyluna-pathology:/Users/rosed2/Documents/msk-mind/luna/pyluna-common:.
env: LUNA_HOME=/Users/rosed2/Documents/msk-mind/luna
env: PYTHONPATH=/Users/rosed2/Documents/msk-mind/luna/pyluna-pathology:/Users/rosed2/Documents/msk-mind/luna/pyluna-common:.
[7]:
!infer_tiles --help
2022-04-04 15:07:49,991 - INFO - root - FYI: Initalized logger, log file at: data-processing.log with handlers: [<StreamHandler <stderr> (INFO)>, <RotatingFileHandler /Users/rosed2/Documents/msk-mind/luna/docker/luna_tutorial/vmount/notebooks/data-processing.log (INFO)>]
Usage: infer_tiles [OPTIONS] INPUT_SLIDE_TILES

  Run a model with a specific pre-transform for all tiles in a slide
  (tile_images), requires tiles to be saved (save_tiles) first

  Inputs:
      input_slide_tiles: path to tile images (.tiles.csv)

  Outputs:
      tile_scores

  Example:
      infer_tiles tiles/slide-100012/tiles
          -rn msk-mind/luna-ml:main
          -mn tissue_tile_net_model_5_class
          -tn tissue_tile_net_transform
          -wt main:tissue_net_2021-01-19_21.05.24-e17.pth
          -o tiles/slide-100012/scores

Options:
  -o, --output_dir TEXT         path to output directory to save results
  -rn, --hub_repo_or_dir TEXT   repository name to pull model and weight from,
                                e.g. msk-mind/luna-ml

  -tn, --transform_name TEXT    torch hub transform name
  -mn, --model_name TEXT        torch hub model name
  -kw, --kwargs TEXT            additional keywords to pass to model
                                initialization

  -nc, --num_cores INTEGER      Number of cores to use
  -bx, --batch_size INTEGER     batch size used for inference speedup
  -m, --method_param_path TEXT  path to a metadata json/yaml file with method
                                parameters to reproduce results

  --help                        Show this message and exit.
infer_tiles CLI takes in details on your trained model, and loads the tiles data for inference.
[18]:
#!cat ../PRO_12-123/tables/tiles/01OV008-7579323e-2fae-43a9-b00f-a15c28/ov_default_labels/TileImages/data/address.slice.csv

# Copied pyluna-pathology/tests/luna/pathology/cli/testdata/data/save_tiles/123/
!cat ../PRO_12-123/sample_tiles/123.tiles.csv
address,x_coord,y_coord,xy_extent,tile_size,tile_units,tile_store
x1_y1_z10.0,512,512,512,256,px,pyluna-pathology/tests/luna/pathology/cli/testdata/data/save_tiles/123/123.tiles.h5
x1_y2_z10.0,512,1024,512,256,px,pyluna-pathology/tests/luna/pathology/cli/testdata/data/save_tiles/123/123.tiles.h5
x1_y3_z10.0,512,1536,512,256,px,pyluna-pathology/tests/luna/pathology/cli/testdata/data/save_tiles/123/123.tiles.h5
x1_y4_z10.0,512,2048,512,256,px,pyluna-pathology/tests/luna/pathology/cli/testdata/data/save_tiles/123/123.tiles.h5
x2_y1_z10.0,1024,512,512,256,px,pyluna-pathology/tests/luna/pathology/cli/testdata/data/save_tiles/123/123.tiles.h5
x2_y2_z10.0,1024,1024,512,256,px,pyluna-pathology/tests/luna/pathology/cli/testdata/data/save_tiles/123/123.tiles.h5
x2_y3_z10.0,1024,1536,512,256,px,pyluna-pathology/tests/luna/pathology/cli/testdata/data/save_tiles/123/123.tiles.h5
x2_y4_z10.0,1024,2048,512,256,px,pyluna-pathology/tests/luna/pathology/cli/testdata/data/save_tiles/123/123.tiles.h5
x3_y1_z10.0,1536,512,512,256,px,pyluna-pathology/tests/luna/pathology/cli/testdata/data/save_tiles/123/123.tiles.h5
x3_y2_z10.0,1536,1024,512,256,px,pyluna-pathology/tests/luna/pathology/cli/testdata/data/save_tiles/123/123.tiles.h5
x3_y3_z10.0,1536,1536,512,256,px,pyluna-pathology/tests/luna/pathology/cli/testdata/data/save_tiles/123/123.tiles.h5
x3_y4_z10.0,1536,2048,512,256,px,pyluna-pathology/tests/luna/pathology/cli/testdata/data/save_tiles/123/123.tiles.h5
[20]:
!infer_tiles ../PRO_12-123/sample_tiles/123.tiles.csv \
--output_dir ../PRO_12-123/sample_tiles_inference \
--hub_repo_or_dir ../classifier \
--model_name test_custom_model \
#--model_name tissue_tile_net_model_5_class \
--num_cores 1 \
--batch_size 16
2022-04-04 15:58:01,312 - INFO - root - FYI: Initalized logger, log file at: data-processing.log with handlers: [<StreamHandler <stderr> (INFO)>, <RotatingFileHandler /Users/rosed2/Documents/msk-mind/luna/docker/luna_tutorial/vmount/notebooks/data-processing.log (INFO)>]
2022-04-04 15:58:01,313 - INFO - luna.common.utils - Running <function infer_tile_labels at 0x16239e940> with {'output_dir': '../PRO_12-123/sample_tiles_inference', 'hub_repo_or_dir': '../classifier', 'model_name': 'test_custom_model', 'input_slide_tiles': '../PRO_12-123/sample_tiles/123.tiles.csv', 'transform_name': None, 'kwargs': {}, 'num_cores': 4, 'batch_size': 64, 'method_param_path': None}
2022-04-04 15:58:01,313 - INFO - luna.common.utils - Param input_slide_tiles set = ../PRO_12-123/sample_tiles/123.tiles.csv
2022-04-04 15:58:01,313 - INFO - luna.common.utils - Param output_dir set = ../PRO_12-123/sample_tiles_inference
2022-04-04 15:58:01,313 - INFO - luna.common.utils - Param hub_repo_or_dir set = ../classifier
2022-04-04 15:58:01,313 - INFO - luna.common.utils - Param model_name set = test_custom_model
2022-04-04 15:58:01,314 - INFO - luna.common.utils - Param kwargs set = {}
2022-04-04 15:58:01,314 - INFO - luna.common.utils - Param num_cores set = 4
2022-04-04 15:58:01,314 - INFO - luna.common.utils - Param batch_size set = 64
../PRO_12-123/sample_tiles/123.tiles.csv/metadata.yml
2022-04-04 15:58:01,314 - INFO - luna.common.utils - Full segment key set: {}

----------------------------------- Running transform::infer_tile_labels -----------------------------------

2022-04-04 15:58:01,314 - INFO - infer_tile_labels - Torch hub source = local @ ../classifier
2022-04-04 15:58:01,315 - INFO - infer_tile_labels - Using device = cpu
100%|█████████████████████████████████████████████| 1/1 [00:08<00:00,  8.80s/it]
2022-04-04 15:58:10,126 - INFO - infer_tile_labels - Mapping column labels -> {0: 'Background', 1: 'Tumor'}
2022-04-04 15:58:10,134 - INFO - infer_tile_labels -              x_coord  y_coord  ...  Background     Tumor
2022-04-04 15:58:10,134 - INFO - infer_tile_labels - address                        ...
2022-04-04 15:58:10,134 - INFO - infer_tile_labels - x1_y1_z10.0      512      512  ...   -0.162288  1.159485
2022-04-04 15:58:10,134 - INFO - infer_tile_labels - x1_y2_z10.0      512     1024  ...   -0.151000  1.070280
2022-04-04 15:58:10,134 - INFO - infer_tile_labels - x1_y3_z10.0      512     1536  ...   -0.146432  1.033477
2022-04-04 15:58:10,134 - INFO - infer_tile_labels - x1_y4_z10.0      512     2048  ...   -0.136010  0.933327
2022-04-04 15:58:10,134 - INFO - infer_tile_labels - x2_y1_z10.0     1024      512  ...   -0.098171  0.691738
2022-04-04 15:58:10,134 - INFO - infer_tile_labels - x2_y2_z10.0     1024     1024  ...   -0.090072  0.663284
2022-04-04 15:58:10,134 - INFO - infer_tile_labels - x2_y3_z10.0     1024     1536  ...   -0.091160  0.654910
2022-04-04 15:58:10,134 - INFO - infer_tile_labels - x2_y4_z10.0     1024     2048  ...   -0.107406  0.732663
2022-04-04 15:58:10,134 - INFO - infer_tile_labels - x3_y1_z10.0     1536      512  ...   -0.158197  1.147173
2022-04-04 15:58:10,134 - INFO - infer_tile_labels - x3_y2_z10.0     1536     1024  ...   -0.135955  1.007193
2022-04-04 15:58:10,134 - INFO - infer_tile_labels - x3_y3_z10.0     1536     1536  ...   -0.152792  1.108577
2022-04-04 15:58:10,134 - INFO - infer_tile_labels - x3_y4_z10.0     1536     2048  ...   -0.127656  0.930692
2022-04-04 15:58:10,134 - INFO - infer_tile_labels -
2022-04-04 15:58:10,134 - INFO - infer_tile_labels - [12 rows x 8 columns]
2022-04-04 15:58:10,162 - INFO - luna.common.utils - Code block 'transform::infer_tile_labels' took: 8.848070255s
2022-04-04 15:58:10,164 - INFO - luna.common.utils - Done.
The output of the inference is saved in a CSV. Let’s take a look at the results.
[21]:
!ls -lhtr ../PRO_12-123/sample_tiles_inference
total 16
-rw-r--r--  1 rosed2  MSKCC\Domain Users   1.2K Apr  4 15:58 tile_scores_and_labels_pytorch_inference.csv
-rw-r--r--  1 rosed2  MSKCC\Domain Users   446B Apr  4 15:58 metadata.yml
Note that for the purpose of the tutorials, we are working with a small toy dataset, and therefore the inference result is not optimal. This result is for demonstration purposes only.
[23]:
import pandas as pd

results = pd.read_csv("../PRO_12-123/sample_tiles_inference/tile_scores_and_labels_pytorch_inference.csv")
results
[23]:
| address | x_coord | y_coord | xy_extent | tile_size | tile_units | tile_store | Background | Tumor | |
|---|---|---|---|---|---|---|---|---|---|
| 0 | x1_y1_z10.0 | 512 | 512 | 512 | 256 | px | ../PRO_12-123/sample_tiles/123.tiles.h5 | -0.162288 | 1.159485 |
| 1 | x1_y2_z10.0 | 512 | 1024 | 512 | 256 | px | ../PRO_12-123/sample_tiles/123.tiles.h5 | -0.151000 | 1.070280 |
| 2 | x1_y3_z10.0 | 512 | 1536 | 512 | 256 | px | ../PRO_12-123/sample_tiles/123.tiles.h5 | -0.146432 | 1.033477 |
| 3 | x1_y4_z10.0 | 512 | 2048 | 512 | 256 | px | ../PRO_12-123/sample_tiles/123.tiles.h5 | -0.136010 | 0.933327 |
| 4 | x2_y1_z10.0 | 1024 | 512 | 512 | 256 | px | ../PRO_12-123/sample_tiles/123.tiles.h5 | -0.098171 | 0.691738 |
| 5 | x2_y2_z10.0 | 1024 | 1024 | 512 | 256 | px | ../PRO_12-123/sample_tiles/123.tiles.h5 | -0.090072 | 0.663284 |
| 6 | x2_y3_z10.0 | 1024 | 1536 | 512 | 256 | px | ../PRO_12-123/sample_tiles/123.tiles.h5 | -0.091160 | 0.654910 |
| 7 | x2_y4_z10.0 | 1024 | 2048 | 512 | 256 | px | ../PRO_12-123/sample_tiles/123.tiles.h5 | -0.107406 | 0.732663 |
| 8 | x3_y1_z10.0 | 1536 | 512 | 512 | 256 | px | ../PRO_12-123/sample_tiles/123.tiles.h5 | -0.158197 | 1.147173 |
| 9 | x3_y2_z10.0 | 1536 | 1024 | 512 | 256 | px | ../PRO_12-123/sample_tiles/123.tiles.h5 | -0.135955 | 1.007193 |
| 10 | x3_y3_z10.0 | 1536 | 1536 | 512 | 256 | px | ../PRO_12-123/sample_tiles/123.tiles.h5 | -0.152792 | 1.108577 |
| 11 | x3_y4_z10.0 | 1536 | 2048 | 512 | 256 | px | ../PRO_12-123/sample_tiles/123.tiles.h5 | -0.127656 | 0.930692 |
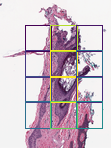
Visualize the inference results#
Now we will visualize the inference results. visualize_tiles_ng CLI creates heatmaps based on the scores, and saves the thumbnail images in png format.
[27]:
!visualize_tiles_png --help
2022-04-04 16:05:18,158 - INFO - root - FYI: Initalized logger, log file at: data-processing.log with handlers: [<StreamHandler <stderr> (INFO)>, <RotatingFileHandler /Users/rosed2/Documents/msk-mind/luna/docker/luna_tutorial/vmount/notebooks/data-processing.log (INFO)>]
Usage: visualize_tiles_png [OPTIONS] INPUT_SLIDE_IMAGE INPUT_SLIDE_TILES

  Generate nice tile markup images with continuous or discrete tile scores

  Inputs:
      input_slide_image: slide image (virtual slide formats compatible with openslide, .svs, .tif, .scn, ...)
      input_slide_tiles: slide tiles (manifest tile files, .tiles.csv)

  Outputs:
      markups: markup images

  Example:
      visualize_tiles_png 10001.svs 10001/tiles/10001.tiles.csv
          -o 10001/markups
          -pl Tumor,Stroma,TILs,otsu_score
          -rmg 0.5

Options:
  -o, --output_dir TEXT           path to output directory to save results
  -pl, --plot_labels TEXT         Label names (as column labels) to plot
  -rmg, --requested_magnification TEXT
                                  Magnificiation scale at which to generate
                                  thumbnail/png images (recommended <= 1)

  --mpp-units                     Set this flag if input coordinates are in
                                  µm, not pixels

  -m, --method_param_path TEXT    path to a metadata json/yaml file with
                                  method parameters to reproduce results

  --help                          Show this message and exit.
If you want to evaluate your model results in detail, it is desirable to review the results and images in high-magnification. We use Digital Slide Archive (DSA) viewer to examine the high resolution image and results. DSA is a web-based platform and this enables us to easily share the images and model results with other researchers via a link.
A set of CLIs are available to help you convert your pathologist or model-generated annotations and push them to DSA. Please refer to the dsa-tools.ipynb notebook for more details.
[8]:
!visualize_tiles_png \
../PRO_12-123/123.svs \
../PRO_12-123/sample_tiles_inference/tile_scores_and_labels_pytorch_inference.csv \
--output_dir ../PRO_12-123/sample_tiles_viz \
--plot_labels Background,Tumor \
--requested_magnification 1
2022-04-05 08:07:23,436 - INFO - root - FYI: Initalized logger, log file at: data-processing.log with handlers: [<StreamHandler <stderr> (INFO)>, <RotatingFileHandler /Users/rosed2/Documents/msk-mind/luna/docker/luna_tutorial/vmount/notebooks/data-processing.log (INFO)>]
2022-04-05 08:07:24,597 - INFO - luna.common.utils - Running <function visualize_tiles at 0x11f211ca0> with {'output_dir': '../PRO_12-123/sample_tiles_viz', 'plot_labels': 'Background,Tumor', 'requested_magnification': '1', 'input_slide_image': '../PRO_12-123/123.svs', 'input_slide_tiles': '../PRO_12-123/sample_tiles_inference/tile_scores_and_labels_pytorch_inference.csv', 'mpp_units': False, 'method_param_path': None}
2022-04-05 08:07:24,597 - INFO - luna.common.utils - Param input_slide_image set = ../PRO_12-123/123.svs
2022-04-05 08:07:24,597 - INFO - luna.common.utils - Param input_slide_tiles set = ../PRO_12-123/sample_tiles_inference/tile_scores_and_labels_pytorch_inference.csv
2022-04-05 08:07:24,597 - INFO - luna.common.utils - Param mpp_units set = False
2022-04-05 08:07:24,597 - INFO - luna.common.utils - Param plot_labels set = ['Background', 'Tumor']
2022-04-05 08:07:24,597 - INFO - luna.common.utils - Param requested_magnification set = 1.0
2022-04-05 08:07:24,598 - INFO - luna.common.utils - Param output_dir set = ../PRO_12-123/sample_tiles_viz
../PRO_12-123/123.svs/metadata.yml
../PRO_12-123/sample_tiles_inference/tile_scores_and_labels_pytorch_inference.csv/metadata.yml
2022-04-05 08:07:24,598 - INFO - luna.common.utils - Full segment key set: {}

----------------------------------- Running transform::visualize_tiles -----------------------------------

100%|██████████████████████████████████████████| 12/12 [00:00<00:00, 999.50it/s]
2022-04-05 08:07:24,932 - INFO - visualize_tiles_png - Saved Tumor visualization at ../PRO_12-123/sample_tiles_viz/tile_scores_and_labels_visualization_Tumor.png
100%|█████████████████████████████████████████| 12/12 [00:00<00:00, 1287.16it/s]
2022-04-05 08:07:24,950 - INFO - visualize_tiles_png - Saved Background visualization at ../PRO_12-123/sample_tiles_viz/tile_scores_and_labels_visualization_Background.png
2022-04-05 08:07:24,956 - INFO - luna.common.utils - Code block 'transform::visualize_tiles' took: 0.35854921900000014s
2022-04-05 08:07:24,958 - INFO - luna.common.utils - Done.
[9]:
from IPython.display import Image

Image('../PRO_12-123/sample_tiles_viz/tile_scores_and_labels_visualization_Background.png')
[9]:
Congratulations on completing the inference and visualization notebook! To view the end-to-end pipeline of the tiling workflow, please checkout the end-to-end notebook.
[ ]: